Using ProcDump to Monitor Windows 8 Store Apps
Introduction
There may be some instances where you want to monitor Windows 8 Store Apps without installing Visual Studio 2012. Thankfully you can do this pretty easily by using ProcDump and ProcessMonitor. Here is a step-by-step guide on how to do so or if you prefer watch this video which inspired me to write this post.
Step 1:
As described by it’s author : “ProcDump is a command-line utility whose primary purpose is monitoring an application for CPU spikes and generating crash dumps during a spike that an administrator or developer can use to determine the cause of the spike. ProcDump also includes hung window monitoring (using the same definition of a window hang that Windows and Task Manager use) unhandled exception monitoring and can generate dumps based on the values of system performance counters. It also can serve as a general process dump utility that you can embed in other scripts.”
Download Process Monitor v3.03
As described by it’s author : “Process Monitor is an advanced monitoring tool for Windows that shows real-time file system Registry and process/thread activity. It combines the features of two legacy Sysinternals utilities Filemon and Regmon and adds an extensive list of enhancements including rich and non-destructive filtering comprehensive event properties such session IDs and user names reliable process information full thread stacks with integrated symbol support for each operation simultaneous logging to a file and much more. Its uniquely powerful features will make Process Monitor a core utility in your system troubleshooting and malware hunting toolkit.”
Step 2:
Open the registry and browse to the following folder: HKEY_CURRENT_USER\Software\Classes\ActivatableClasses\Package. Once there navigate to the application you want to monitor. In this case we are going to monitor the built-in Camera Application.
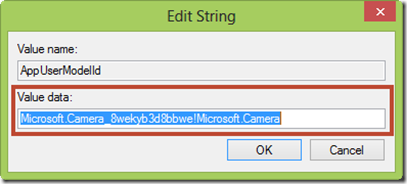
Click on the Application Folder then Server and double-click AppUserModelID as shown below.
Copy and paste the string value highlighted below.
Step 3:
Navigate over to where you extracted the procdump and procmon tools and run the following command (exchange the camera part with whatever value your App.UserModelID is)
procdump -e 1 -f "" -x c:\procdump Microsoft.Camera_8wekyb3d8bbwe!Microsoft.Camera
Note: You can easily see what each switch does by just calling procdump from the command prompt. In this case we are using the following:
-e Write a dump when the process encounters an unhandled exception.
Include the 1 to create dump on first chance exceptions.
-f Filter the first chance exceptions. Wildcards (*) are supported.
To just display the names without dumping use a blank ("") filter.
-x Launch the specified image with optional arguments.
If it is a Modern Application or Package ProcDump will start
on the next activation (only).
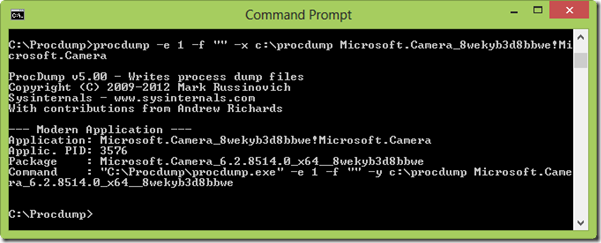
Your Windows Store App will launch. Switch back over to the Desktop mode and look in the Command Prompt as shown below.
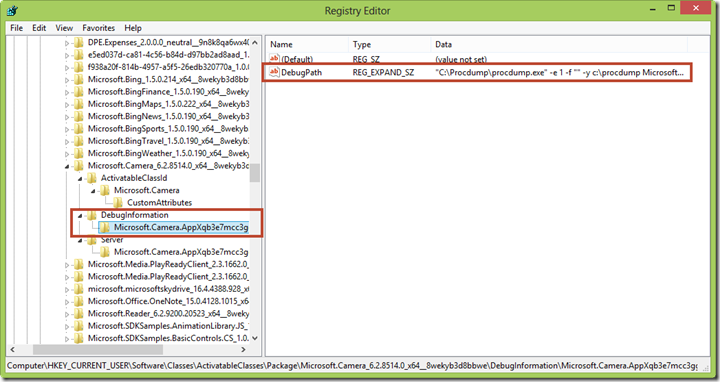
With RegEdit still open hit F5 to refresh the screen and notice the new folder called “DebugInformation” with a key called “DebugPath”:
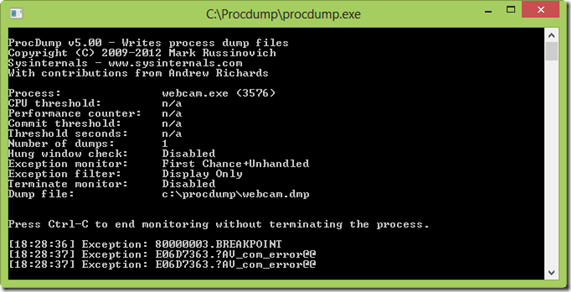
You will also see an additional window that provides info about the current file it is monitoring and includes any caught exceptions:
As stated you can hit Ctrl-C to quit monitoring the app without terminating the process. You are also free to monitor the dmp file created.
Step 4 – Additional Info:
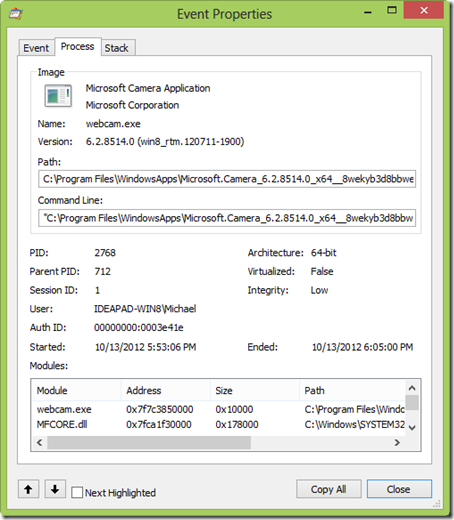
While the application is running you can now open procmon.exe and filter by the process name or even better the process id to monitor the event properties.
You can double click on any event and see the event process and stack.
Wrap-up
I have always been a fan of Sysinternal and I am very happy that procdump works wonderfully with Windows 8 Store Apps. If you have any questions then feel free to leave them below otherwise see you in the next post!


![SNAGHTMLae07e14[4] SNAGHTMLae07e14[4]](http://michaelcrump.net/files/SNAGHTMLae07e14%5B4%5D_thumb_634858793403840268.png)
Leave a Comment