Getting Rid of the “Plug-in Not Responding” Message when Debugging Silverlight Applications in Chrome
Introduction
I really love building Silverlight Applications and debugging with Chrome. One thing that I hate though is the constant popups that I get from Chrome telling me my plug-in is unresponsive when I’m trying to figure out why something isn’t working. I decided to take a few minutes and find out how to solve this once and for all and share it with you. Below you will see my normal routine and how easily we can solve this.
The Normal Routine
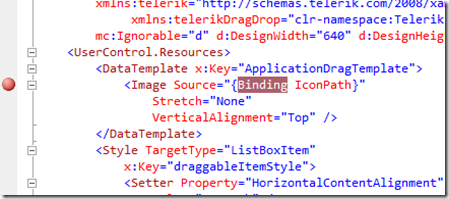
I set a break point on a line:
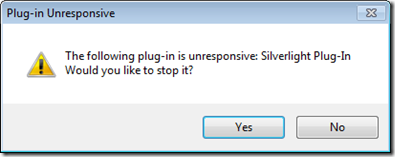
I start debugging my application and begin inspecting the Binding Statement or whatever and eventually Chrome gives me this message:
I hit the No button and eventually it comes up again asking the same question.
The Solution
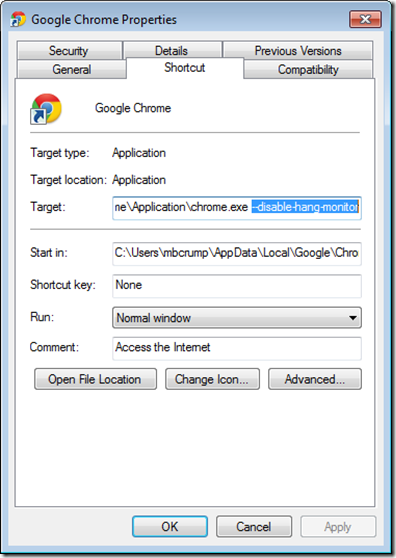
Multiple Solutions exists for this but it all boils down to adding an extra parameter called --disable-hang-monitor to the command line.
So for example I usually open an instance of chrome before debugging my SL applications. I went ahead and create a shortcut to chrome and add the parameter after chrome.exe as shown below.
You may have times when you are not debugging and wish for Chrome to notify you the plug-in is not responding. In this case simply add another shortcut without the additional parameter.
Other More Permanent Ways
If you want to just set this parameter system wide then you can do that by opening Regedit and navigate to the following key: HKEY_CLASSES_ROOT\ChromeHTML\shell\open\command
Change the default key to look like the following: "C:\Users\your user name here\AppData\Local\Google\Chrome\Application\chrome.exe" --disable-hang-monitor -- "%1"
You are now ready to enjoy Chrome without ever seeing the plug-in warning again.
Wrap-Up
It is funny how these little things can annoying you to the point where you begin investigating how to fix it. I know that was my case. Anyways I hope this post helps someone out there!


Leave a Comment